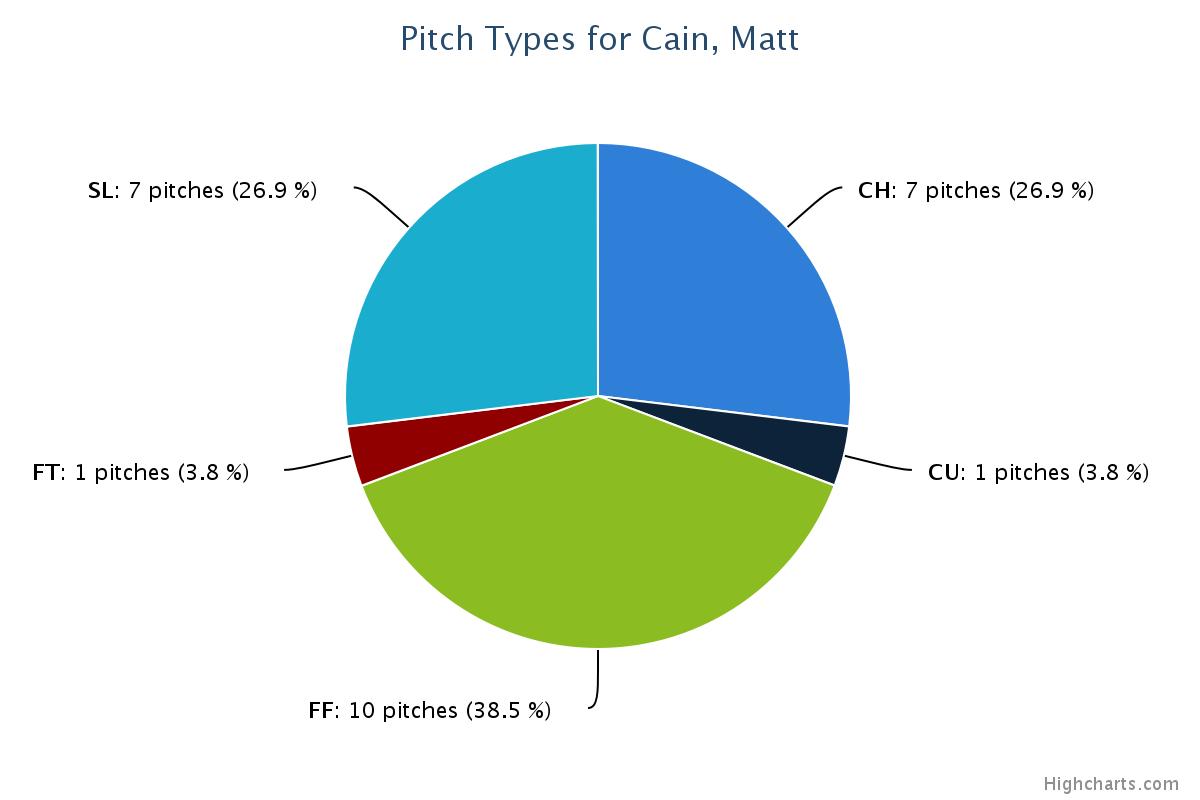
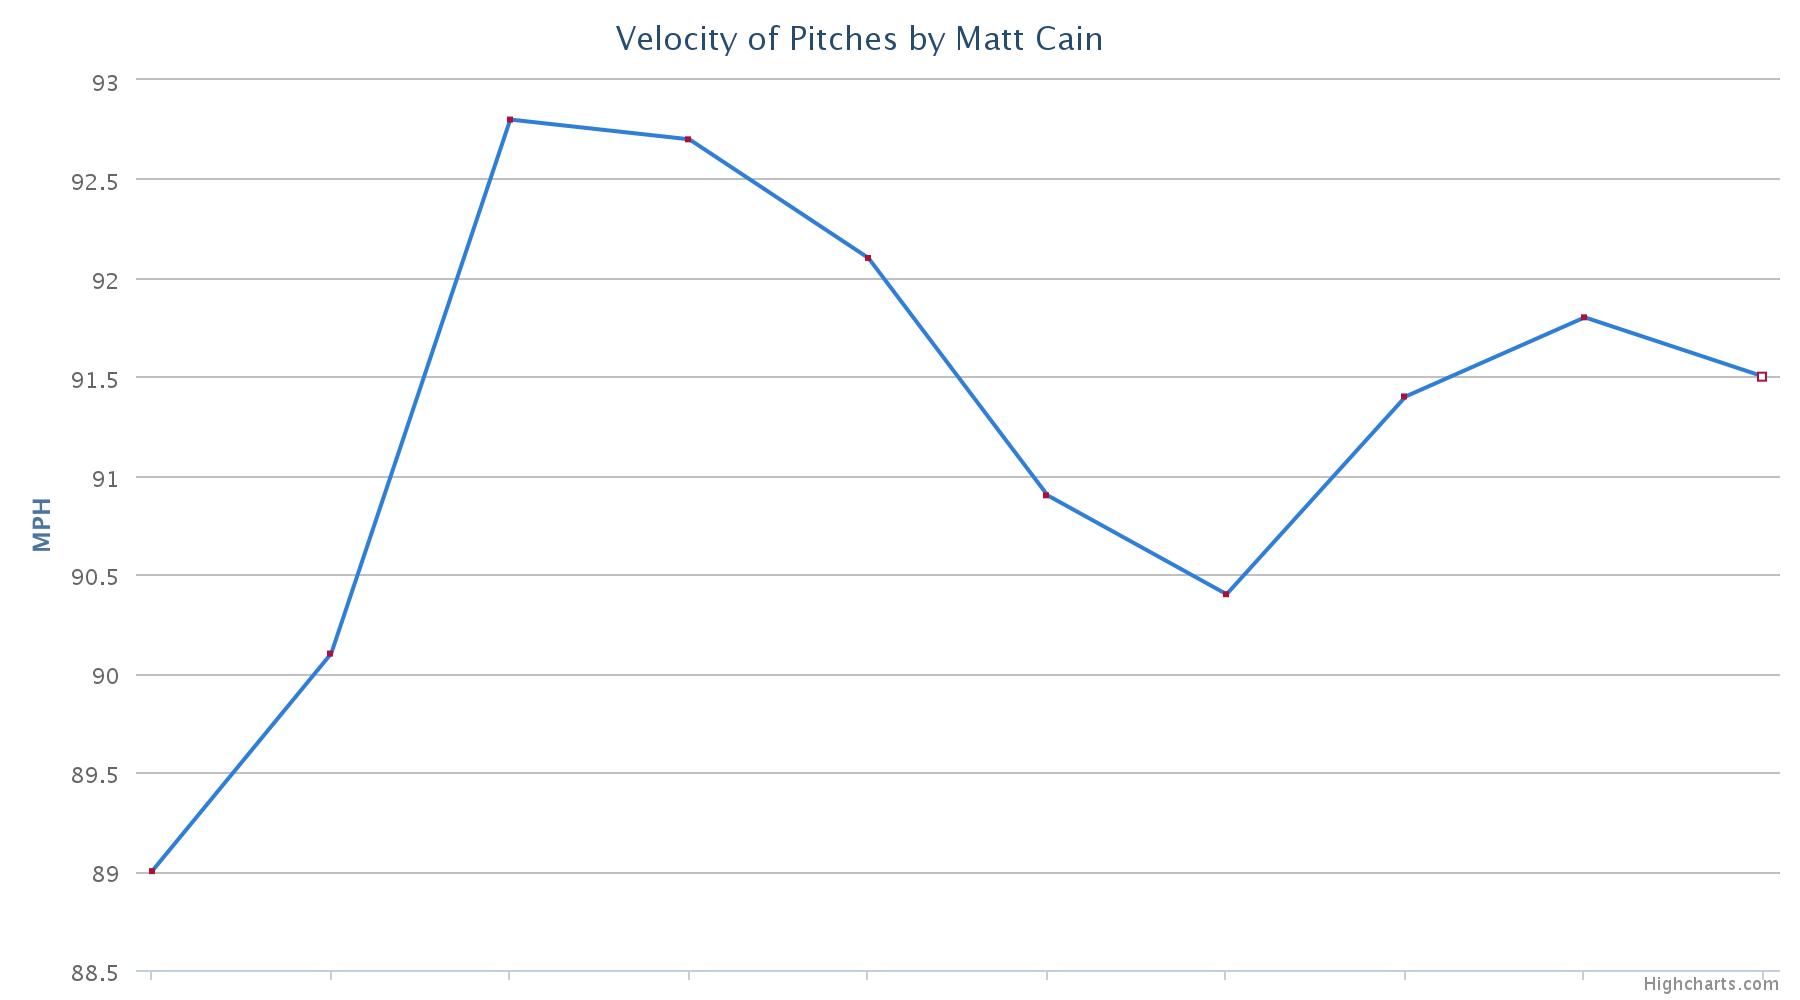
This week on the podcast, Thomas and I talked about the curious case of Matt Cain’s 2016 season. My theory was that after not pitching much for the last year and a half, and missing time in Spring Training with his cyst issue, he entered the season without the stamina that a starting pitcher would need. That’s why it seems like he’s perfectly fine for the first four innings, before he falls off a cliff. Then I saw these charts from his most recent start:


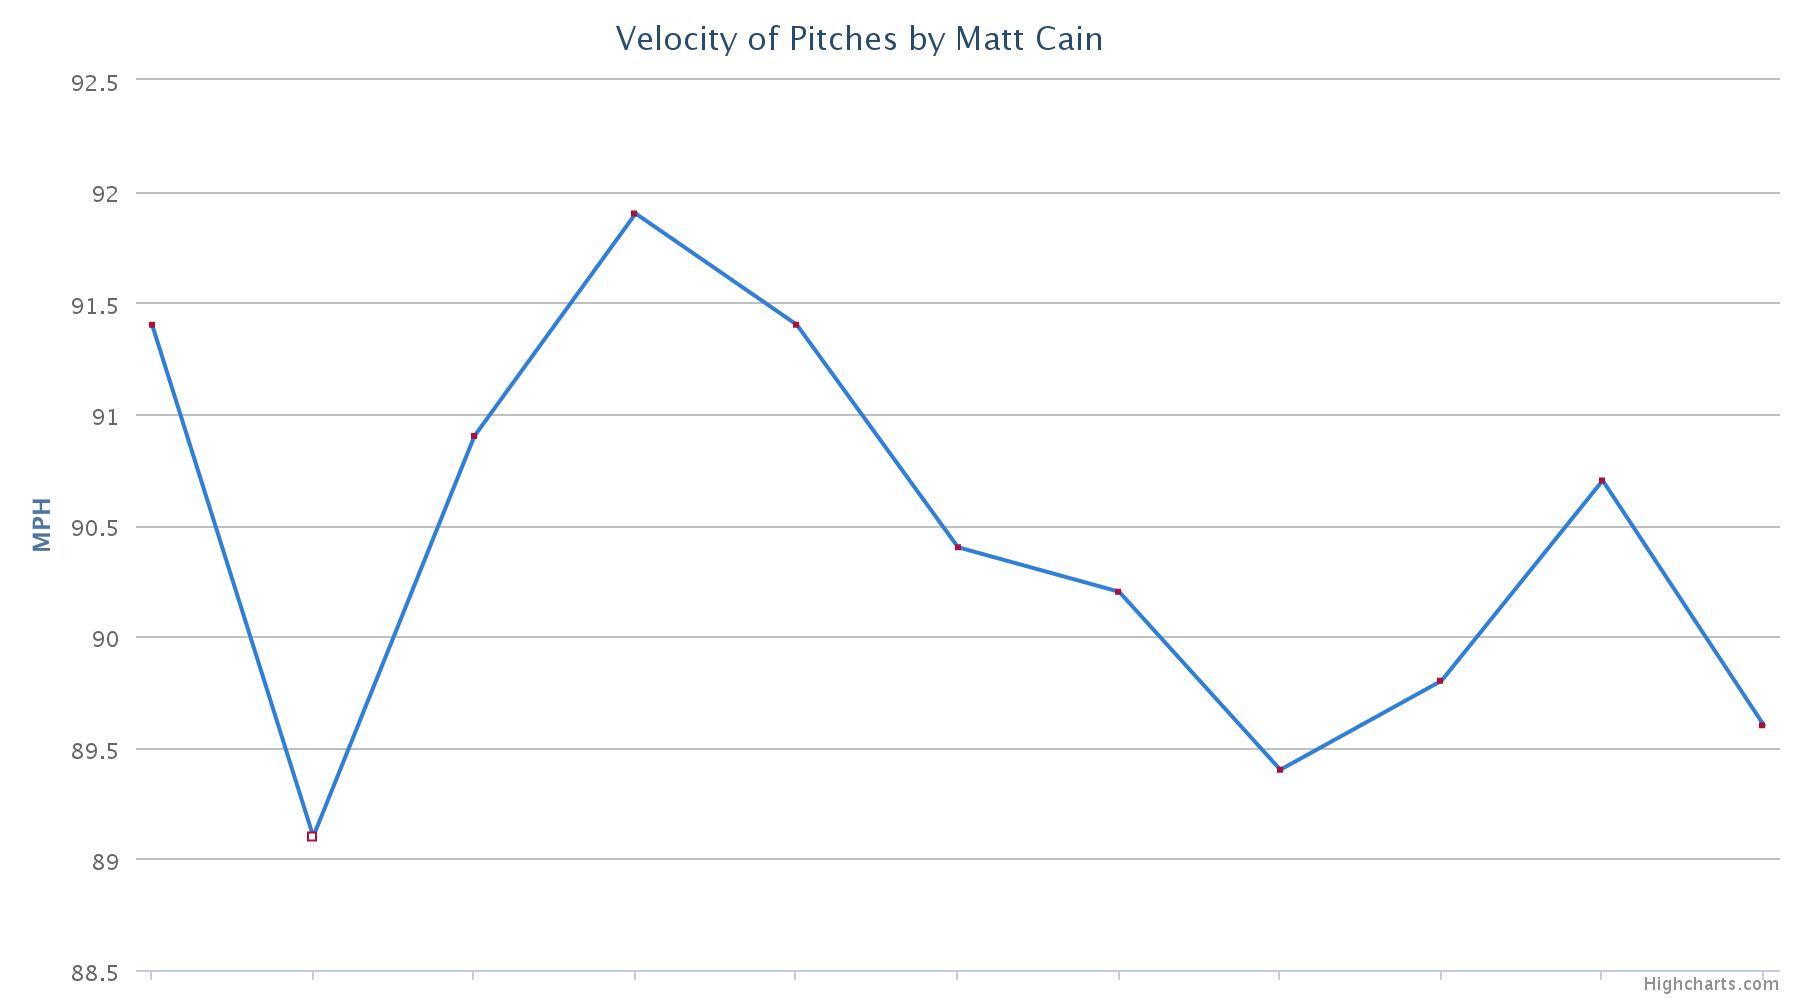
In other words, everything is fine, fine, fine… sitting 91-92, and then BAM, he becomes Barry Zito. Suspicions confirmed! Let’s just look back to his other awful starts to make sure that’s what happened then too. Doesn’t really seem necessary because it fits my narrative so well, but just in case let’s take a look and…

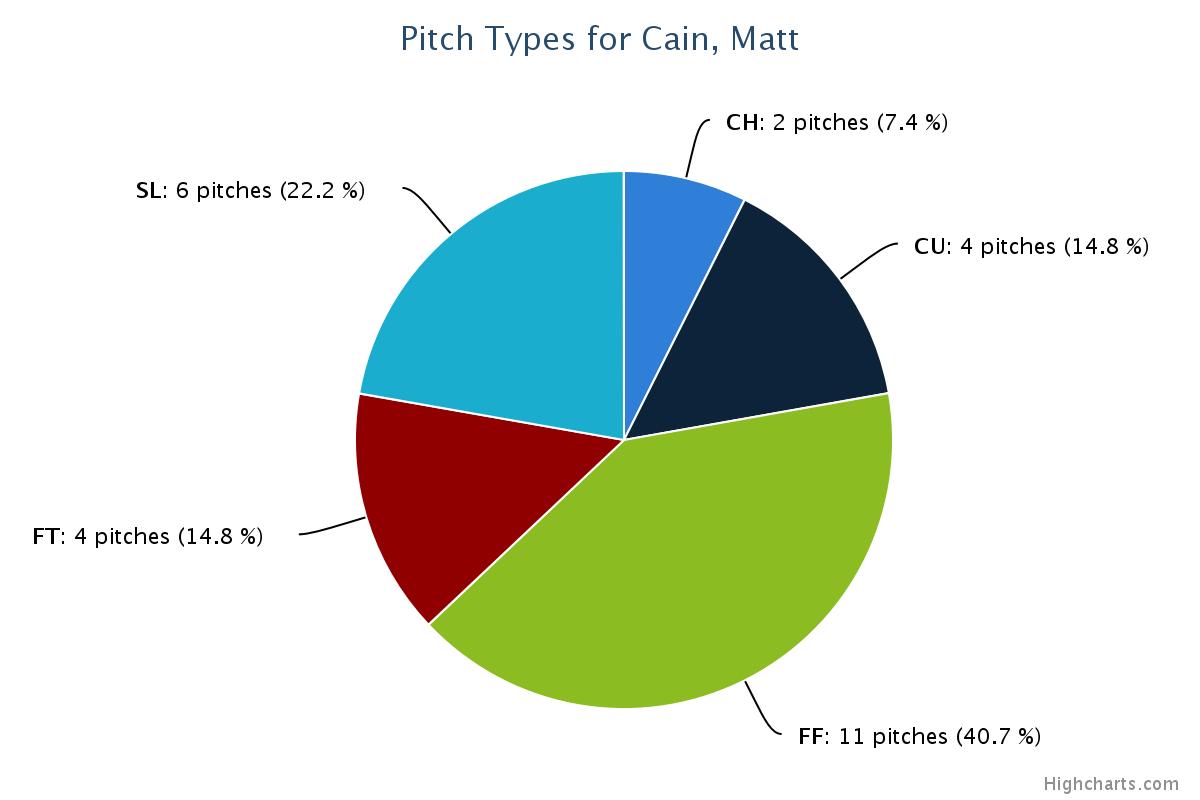
ah dang. There goes that theory. Just for comparison’s sake, let’s look at all five of his starts, side by side:


So we see a general trend of velocity issues, but no massive cliff like what I had theorized. Let’s take another look at a nifty feature BrooksBaseball has called “Grooved Pitches.” What you’re going to see here is a breakdown of Cain’s pitches by pitch type, and the percentage of each that Pitch f/x considers “grooved.”
| Year | Fourseam | Sinker | Change | Slider | Curve | Cutter |
|---|---|---|---|---|---|---|
| 2007 | 5.75 | 7.14 | 3.49 | 4.76 | 3.45 | 0.00 |
| 2008 | 6.35 | 3.13 | 3.61 | 4.55 | 5.76 | 0.00 |
| 2009 | 7.21 | 5.92 | 4.04 | 6.76 | 5.69 | 0.00 |
| 2010 | 6.06 | 4.55 | 2.41 | 4.83 | 6.33 | 0.00 |
| 2011 | 6.66 | 1.20 | 2.18 | 5.53 | 3.74 | 0.00 |
| 2012 | 7.82 | 2.75 | 1.82 | 7.24 | 6.97 | 0.00 |
| 2013 | 8.25 | 4.83 | 1.52 | 4.98 | 6.19 | 0.00 |
| 2014 | 7.13 | 7.89 | 1.62 | 5.43 | 2.76 | 0.00 |
| 2015 | 6.02 | 5.06 | 3.25 | 5.43 | 3.81 | 0.00 |
| 2016 | 6.97 | 16.67 | 0.00 | 5.71 | 8.33 | 0.00 |
In other words, he’s always grooved some pitches. Every pitcher makes mistakes. But this year he’s grooving almost everything a little more, and his Sinker (which he’s only thrown 18 times) a whole lot more. But the real question is WHY he’s grooving more pitches. Maybe BrooksBaseball doesn’t have the answers I need. Time to turn to my second favorite website, BaseballSavant.com.
Matt Cain has generated 26 swinging strikes (“whiffs”) this season. Let’s take a look.
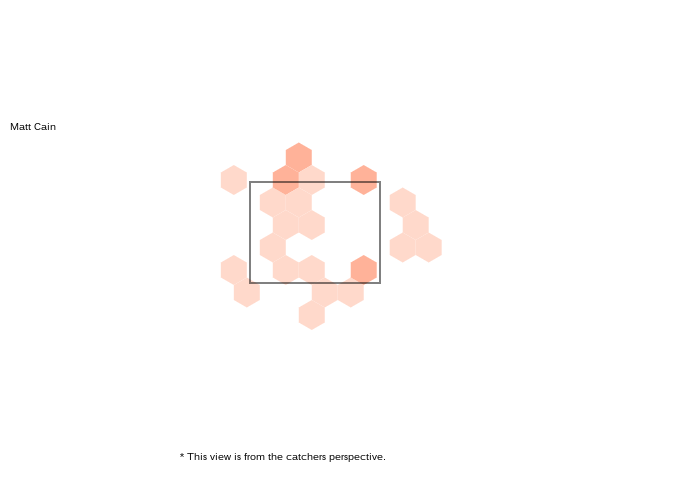
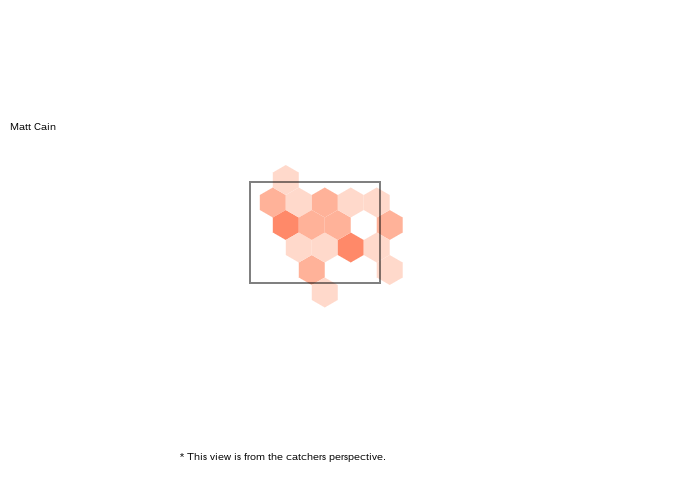
Meanwhile, he’s given up 27 hits. Let’s look at where those came from, and…
Let’s just focus on fastballs for a second. Cain’s main fastball is a four-seamer, and he also throws a two-seamer, which I’m pretty sure is the same pitch that Pitch f/x considers a sinker. So just talking four-seamers for now, let’s focus on Cain’s ability to generate swinging strikes versus propensity to give up hits.
Here’s every swinging strike Cain has generated with his four-seamer this season:
Aside from the very first one, a pitch to Chase Utley, every one of the whiffs came on a pitch over 90 mph, with the vast majority over 91 mph. The fastest was a 92.8 mph country hardball to wunderkind Trevor Story, while probably the most impressive one was a 91.5 mph, full-count pitch that Paul Goldschmidt probably should’ve taken for ball four:
Hot damn, Matty.
Now let’s look at the hits off four-seamers:
See that second pitch up there, an 89.1 mph fastball to Corey Seager? Yeah, that didn’t go well.
So, we have your anecdotal evidence that Cain seems to fade when he gets to 80+ pitches. But you don’t have a sharp numerical decline like I was expecting to see. And even though BrooksBaseball lets us see average velocity per inning…
| Inning | Fourseam | Sinker | Change | Slider | Curve |
|---|---|---|---|---|---|
| 1 | 90.45 | 90.96 | 84.54 | 84.86 | 75.53 |
| 2 | 91.29 | 89.88 | 85.31 | 86.18 | 76.96 |
| 3 | 90.98 | 89.73 | 84.73 | 85.39 | 77.53 |
| 4 | 91.19 | 90.82 | 84.99 | 85.63 | 78.71 |
| 5 | 91.11 | 90.57 | 85.21 | 86.12 | 77.30 |
| 6 | 90.42 | 0.00 | 86.02 | 85.77 | 76.86 |
…and it’s trending downward, it’s not trending downward that much, and I would wager that most starting pitchers not named Noah Syndergaard see a drop in decline as pitch counts rise. So what exactly changes that makes Cain lose it? Just one more graph, I promise. Â Percentage of “Groove Pitches” by the inning:
| Inning | Fourseam | Sinker | Change | Slider | Curve |
|---|---|---|---|---|---|
| 1 | 3.13 | 0.00 | 0.00 | 0.00 | 0.00 |
| 2 | 4.88 | 0.00 | 0.00 | 4.76 | 0.00 |
| 3 | 7.69 | 25.00 | 0.00 | 4.00 | 16.67 |
| 4 | 4.17 | 20.00 | 0.00 | 4.17 | 0.00 |
| 5 | 11.29 | 25.00 | 0.00 | 6.98 | 20.00 |
| 6 | 0.00 | 0.00 | 0.00 | 33.33 | 0.00 |

It’s not like it comes as a big surprise to anyone who has watched him pitch, but he’s just grooving everything as the game goes on. A bit of it is velocity, but mostly it’s just location, location, location.
What does this all mean? Well, Cain has a tendency to throw meatballs as the game wears on, and to make matters worse, his velocity declines a small, but real, amount.  You can take this evidence as a sign that he’s a shell of his former self, and we’re all going to die cold and alone. I choose to find this encouraging.  He’s still capable of pitching at a high level, and the inevitable collapse can be traced directly to pitch count, as opposed to the general undefined ineffectiveness that is Jake Peavy’s season, as Peavy is pitching like Cain but without the initial grace period of competence.
If Cain can somehow improve his stamina during the course of the season, and he can hold off traveling to Groove City longer and longer, everything else is in a position to fall into place. If not, the cavalry ain’t coming to save him.